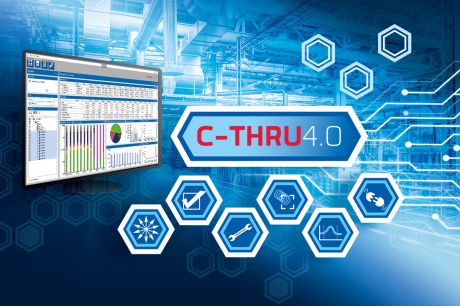
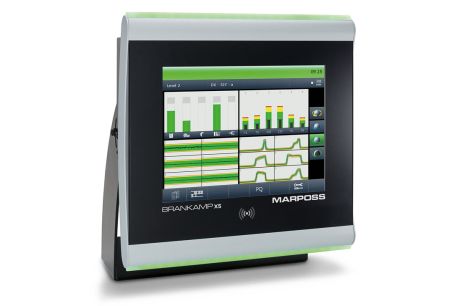
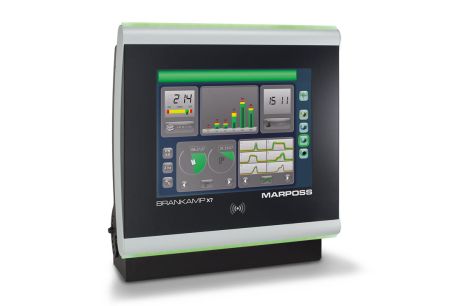
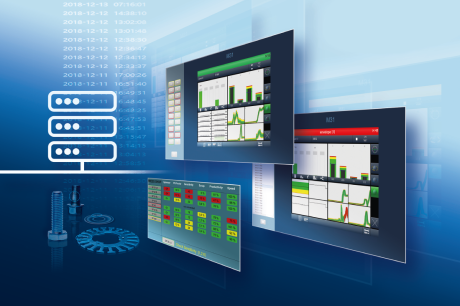
arrow-left-2arrow-left-3arrow-left-4arrow-leftchronodiggdown-arrow--lineardown-arrowearthenvelopefacebookfacebook_ (2)facebook_forward-arrowforwardgooglehomeico-downloadico-linkindustries--1industries--10industries--10_oldindustries--2industries--3industries--4industries--5industries--6industries--6_oldindustries--7industries--8industries--9linkedinmailmarkernewspaperpadlockpage-arrow-leftpage-arrow-rightpage-listpencilpinterestplay-buttonprintersearchsocial-diggsocial-facebooksocial-googlesocial-instagramsocial-linkedinsocial-pinterestsocial-twittersocial-youtubestartelephonetwittertwitter_user

PROCESS DATA ANALYSIS

TrendViewer

Process data in forming and stamping technology are becoming more and more important for the production of high quality parts, process-, tool- and machine optimization and the comparison of different machines, production runs and material suppliers. Force signals, long term trends, stop & go and counter information can be transmitted via network to a server, stored automatically with date and time stamps and are available to various users for immediate and/or subsequent analysis.

 PROCESS DATA ANALYSIS
설명

For the first time process data can be stored with a high frequency and evaluated offline, providing for the user detailed and complete information about the whole production run. Different machines, machine and tool settings, tool and material supplier can be compared and effectively evaluated and conclusions can be made to optimize production, increase productivity and reduce scrap production.

The XBrowser is a server based software tool for the transmission, visualization and storage of time, stroke or process faults event for Brankamp X units. In the TrendViewer software those stored process data files can be reloaded, displayed, filtered and evaluated with different methods and time intervals. Fast analyze of long production runs is easily possible, finding of failure curves, process variations or modification of monitoring limits can be done with a few clicks. The superimposition functions of curve data allows detailed view into selectable parts of the process behavior and conclusions about the production process can drawn about process stability and even tool wear.

Process Quality

  • stored long term process quality
  • easy search for process variation
  • complete process quality documentation

Vario Trend

  • detailed trend information
  • related to a free selectable curve area
  • detailed tool wear analysis

Master Curve

  • Master curve over all selected "production" curves
  • Reference curve for machine and tool setup


장점

This type of post-process data evaluation offers different users (e.g. production manager, tool designer, quality manager etc.) :

  • The possibility to analyze and evaluate his entire process data for the first time
  • With this tool, important conclusions can be found about process variation, setting of monitoring limits and recognition of process influences during the whole production run
  • The knowledge acquired is helpful in determining the optimum process parameters and provides detailed conclusions about tool wear
다운로드

BROCHURES AND MANUALS

브로셔
영어 TREND VIEWER : (1.15MB)
독일어 TREND VIEWER : (1.15MB)
일본어 TREND VIEWER : (6.15MB)
간체 중국어 TREND VIEWER : (1.07MB)
닫기
닫기

정보를 요청하다

이름을 입력하십시오
성을 입력하십시오
회사명을 입력하십시오
이메일을 입력하십시오

담당자에게 직접 메시지가 전달될 수 있도록 아래 목록에서 응용 분야를 선택하여 주십시오.:

메시지를 입력하십시오

Before sending the form please read carefully the INFORMATION NOTICE on personal data processing provided in accordance with the Regulation EU 2016/679.

개인 정보 보호 정책에 동의해 주시기 바랍니다.
Top 문의하기