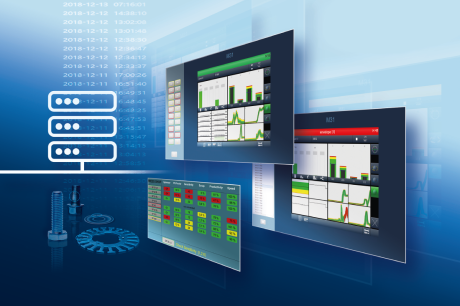
arrow-left-2arrow-left-3arrow-left-4arrow-leftchronodiggdown-arrow--lineardown-arrowearthenvelopefacebookfacebook_ (2)facebook_forward-arrowforwardgooglehomeico-downloadico-linkindustries--1industries--10industries--10_oldindustries--2industries--3industries--4industries--5industries--6industries--6_oldindustries--7industries--8industries--9linkedinmailmarkernewspaperpadlockpage-arrow-leftpage-arrow-rightpage-listpencilpinterestplay-buttonprintersearchsocial-diggsocial-facebooksocial-googlesocial-instagramsocial-linkedinsocial-pinterestsocial-twittersocial-youtubestartelephonetwittertwitter_user

PROCESS DATA ANALYSIS

TrendViewer

Process data in forming and stamping technology are becoming more and more important for the production of high quality parts, process-, tool- and machine optimization and the comparison of different machines, production runs and material suppliers. Force signals, long term trends, stop & go and counter information can be transmitted via network to a server, stored automatically with date and time stamps and are available to various users for immediate and/or subsequent analysis.

 PROCESS DATA ANALYSIS
描述

For the first time process data can be stored with a high frequency and evaluated offline, providing for the user detailed and complete information about the whole production run. Different machines, machine and tool settings, tool and material supplier can be compared and effectively evaluated and conclusions can be made to optimize production, increase productivity and reduce scrap production.

The XBrowser is a server based software tool for the transmission, visualization and storage of time, stroke or process faults event for Brankamp X units. In the TrendViewer software those stored process data files can be reloaded, displayed, filtered and evaluated with different methods and time intervals. Fast analyze of long production runs is easily possible, finding of failure curves, process variations or modification of monitoring limits can be done with a few clicks. The superimposition functions of curve data allows detailed view into selectable parts of the process behavior and conclusions about the production process can drawn about process stability and even tool wear.

Process Quality

  • stored long term process quality
  • easy search for process variation
  • complete process quality documentation

Vario Trend

  • detailed trend information
  • related to a free selectable curve area
  • detailed tool wear analysis

Master Curve

  • Master curve over all selected "production" curves
  • Reference curve for machine and tool setup


优势

This type of post-process data evaluation offers different users (e.g. production manager, tool designer, quality manager etc.) :

  • The possibility to analyze and evaluate his entire process data for the first time
  • With this tool, important conclusions can be found about process variation, setting of monitoring limits and recognition of process influences during the whole production run
  • The knowledge acquired is helpful in determining the optimum process parameters and provides detailed conclusions about tool wear
下载

BROCHURES AND MANUALS

产品资料
英语 TREND VIEWER : (1.15MB)
德语 TREND VIEWER : (1.15MB)
日本语 TREND VIEWER : (6.15MB)
中文 (Simplified Chinese) TREND VIEWER : (1.07MB)
关闭
关闭

请求信息

输入您的名
输入您的姓
输入公司名称
输入您的电子邮箱

为了使邮件能直接被发送给相关负责部门,请在下面列表中的选择对应的应用范围:

输入您的留言

在递交表格前,请您仔细阅读 欧盟第2016/679条 关于如何处理个人资料的条例。.

请接受相关隐私政策。
Top 联系我们